At work I was pretty well known for being an Excel geek. I’ve created a wide array of spreadsheets to do just about anything including structural analysis and design, statistical analysis, financial and operational forecasts, modeling and reporting, 3D physical modeling and even creating scenery for MS Flight Simulator.
One of the major evolution’s in reporting is Data Visualization, namely structuring reports in a way to make it very easy for someone to quickly look at a view or report and immediately understand what is trying to be communicated. This is a fun challenge and one which the later versions of Excel have a number of ways to do this.
Whether you’re planning to view the night sky through the telescope or do astrophotography, knowing when it’s going to be dark and when the moon will be up is vital information. I’ve found some Excel spreadsheets other’s have created that present sunrise/sunset and moonrise/moonset information, but I haven’t found one that makes it easy to quickly visualize the best viewing nights.
I’m in the process of learning Java / Android development so I can create some astronomy apps for my phone, but in the meantime I decided to make an initial Astronomy Calendar in Excel. I’ll get around to directly calculating all the sun and moon data, but for now my spreadsheet simply uses information downloaded from the US Naval Observatory website. The data isn’t structured in a very easy-to-use format, so there’s a lot of processing needed to structure the data in a useful way.
Once I had all the information sorted out I wanted to create a view that provides only essential information and makes it easy to visualize. I decided to avoid macros/VBA and just use some advanced conditional formatting techniques to create a nightly timeline view. This first version came out pretty nice and makes it easy to plan my next imaging sessions. You can click on the image to open it, then once more to view it full size to get the best view.
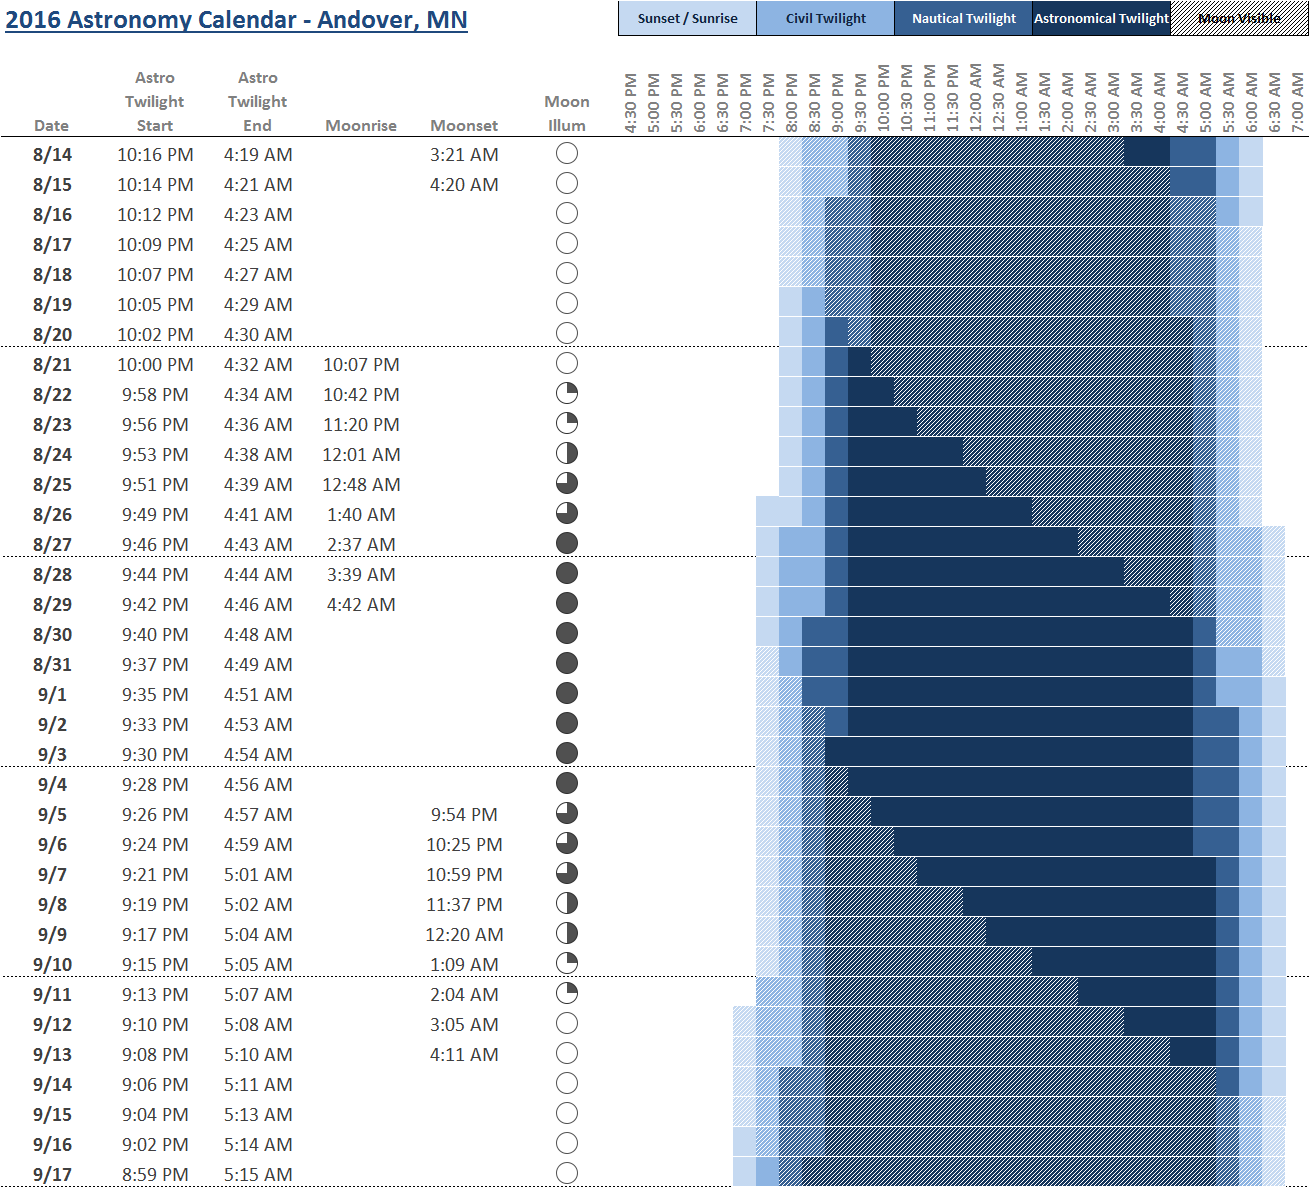
Examples of how I might use this chart:
- Today is August 16th and it’s easy to tell that we’re close to a full moon and that it’s up all night, so dragging out the telescope won’t be very useful. In fact, anytime between now and about August 23rd really isn’t worth the effort.
- On August 25th it will be fully dark (astronomical twilight) at 9:51 pm and the quarter-moon doesn’t even rise until 12:48 am, giving about three solid hours of imaging time. Additionally, shortly after the moon rises and still low on the horizon it won’t brighten much of the rest of the sky, and it’s less than half-illuminated on this night so it’s likely I could image for another hour after moonrise.
- Even the night before might be an option, although the moon comes up 47 minutes earlier. If I was to start imaging during the nautical twilight time period I could probably have plenty of time to image a nebula or other target.
- One of my next imaging target’s is M31 – Andromeda Galaxy, which is best viewed in the Fall. At this time of year it’s pretty low in the sky when it first turns dark, but is at it’s highest in the sky in the early morning hours. I’d probably want to image anywhere from midnight to 4:00 am to get it at it’s highest. Looking at the chart, any night from August 27th through September 10th would likely work.
It seems like this spreadsheet will help a lot with planning my imaging sessions and I like how easy it is to look at different scenarios. I’m planning some additional views, perhaps an accompanying calendar format or something, and may make a few changes to this initial view. Now if I could only do something about the weather!
Of course, once I get a little further along with Java and Android programming I think I’ll try to recreate this type of view but on a much smaller screen and also fully automatically calculate all of the astronomical data based on where you are, dates, etc.
And of course, I’m continuing my proud tradition of being an Excel geek!
Hi Mike, It is many years after your post but I am just becoming aware of my need for exactly the plot you show above. Over the last 5 years or so, have you written an app that produces your useful plot for arbitrary lat-long and date range? If so, I’d really like to use it. If not, would you consider working on it?